fbpx

How Do You Interpret an Eddy Dissipation Rate?

EDR is an aircraft-independent quantifier for how turbulent the atmosphere is, and it’s not a measure of the likelihood of turbulence—just the intensity.

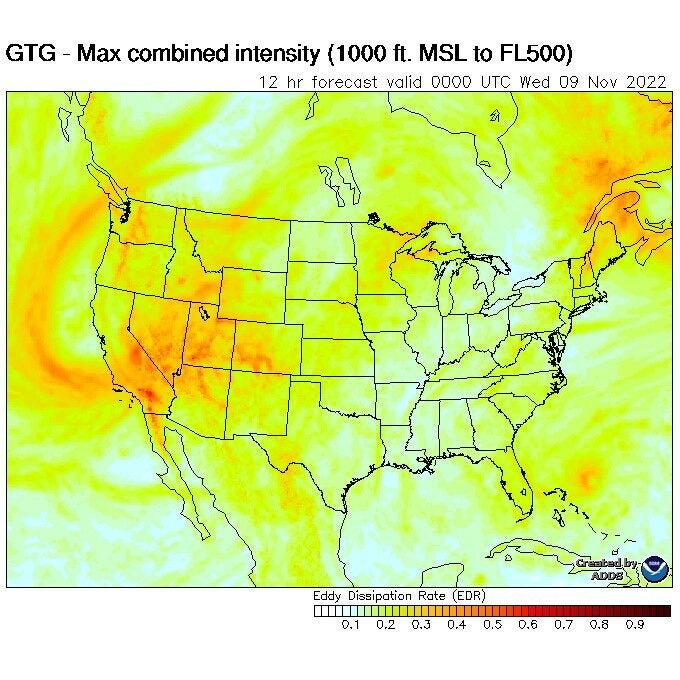
Question: Lately I’ve been hearing the term “eddy dissipation rate” used for turbulence forecasts. What is it and how should I interpret it?

Answer:

If you are a brand new pilot or even one that has a few thousand hours recorded in your logbook, eddy dissipation rate or EDR, is not likely part of your aviation vocabulary. However, if you use aviationweather.gov, the EZWxBrief progressive web app (ezwxbrief.com) or one of the many heavyweight flight planning apps, you have likely stumbled across this relatively new “aviation” term. Let’s define EDR and explore how it should be used by GA pilots.

When confronted with moderate or greater turbulence while in flight, the first response is to slow down below the aircraft’s maneuvering speed, or what is sometimes called turbulence penetration speed. But maneuvering speed is directly dependent on the aircraft’s weight. In other words, the heavier the aircraft, the higher the maneuvering speed. By reducing airspeed, the goal is to reduce the forces (or load) on the aircraft parts that could fail as the aircraft accelerates and decelerates in moderate or greater turbulence. Keep in mind, this is less about the wings falling off and more about the engine mount or other parts failing during an encounter with a jarring turbulence event. Therefore, how can turbulence be quantified for the specific aircraft you fly?

This is the job of EDR. EDR is an aircraft-independent meteorological field expressed in m²/s³ (meters squared per seconds cubed). Simply put, an atmosphere that causes eddies to dissipate rapidly is one that is likely turbulent. Most importantly, EDR is not a measure of the likelihood of turbulence, just the intensity. 

In fluid dynamics, an eddy is the “swirling” of a fluid. Given that air has similar properties as a fluid, there are also eddies in the atmosphere. It’s likely you have seen pictures of wake vortices swirling off the wingtips of a large turbofan aircraft as it passes through clouds or perhaps smoke. It’s important to avoid these wake vortices (which are usually invisible) since they can cause a smaller aircraft following the jet to enter an uncommanded roll. This is referred to as wake turbulence.

In that light, you must pay close attention to the wind with respect to wake turbulence. This is because the prevailing current of wind will cause these vortices to “drift” downwind. If the wind is calm or nearly so, these vortices can persist over the area of concern for some time. Stronger winds will cause the vortices to move farther away from the area and eventually mix out more quickly with time.

Most eddies in the atmosphere do not manifest themselves like these wake vortices. However, imagine such a vortex or “eddy” in the atmosphere. A turbulent atmosphere will cause the eddy to quickly dissipate, whereas an atmosphere with little or no turbulence will allow the eddy to persist. Most importantly, the eddies must be on the scale of the size of the aircraft for you to feel a bumpy ride in the cockpit. From a forecast perspective, nobody is generating eddies in the atmosphere and watching what happens to them, but instead, they are determining what conditions in the atmosphere cause air to mix. An atmosphere that is mixing quite a bit is one that is likely turbulent. EDR is just a measure of how “mix-y” the atmosphere is, or how fast the atmosphere will mix out these eddies, hence the s³ (seconds cubed) in the unit’s denominator. 

EDR is an observed or forecast value that is between 0 and 1 with 0 representing perfectly smooth air and 1 implying supercell thunderstorm level of mixing. It is not critical to understand how this EDR is determined. The EDR value used throughout the EZWxBrief progressive web app is actually EDR x 100. Multiplying EDR by 100 provides a way to turn this into an integer value from 0 to 100 to make it easier to use. For example, an EDR value of 0.23 m²/s³ will be adjusted to 23. 

EDR is not a “one size fits all” kind of weather parameter such as ceiling or visibility. That’s the tricky part of EDR. As mentioned earlier, the turbulence penetration speed is directly related to the weight (class) of the aircraft. So, this means that a pilot flying a Cessna 152 is going to experience turbulence that’s different from a pilot flying a Gulfstream G600. And a Gulfstream G600 will experience turbulence that’s different than an Airbus A320. And an Airbus A320 will experience turbulence that’s different than a Boeing 777. This means an EDR value of 18 may produce moderate turbulence for a Cirrus SR20, but will be considered light turbulence for a Boeing 737.

EDR legend used by aviationweather.gov for light aircraft with values multiplied by 100.

There are three aircraft weight classes in the table below. These include light, medium, and heavy based on the aircraft’s maximum takeoff weight.

  • Light < 15,500 pounds (e.g., Piper Cub, Cirrus SR22, Lear 23)
  • Medium (or large) 15,500 to 300,000 pounds (e.g., A320, B737, GV, MD80)
  • Heavy > 300,000 pounds (e.g., A330, A380, B787, B777)
EDR thresholds multiplied by 100 as they relate to categorical intensities for turbulence. For light aircraft, moderate turbulence begins at an EDR value of 16 and severe begins at an EDR value of 36. 

This table is based on the results of a study done by turbulence researchers at the National Center for Atmospheric Research (NCAR). According to Dr. Robert Sharman, who participated in this study, the idea was to compare pilot weather reports (PIREPs) with in situ EDR data for the same location and altitude. But they only had medium weight class data (e.g., B737) for comparisons, and the statistical spread was quite large. So, these researchers used the medians for comparison. Then they used a theoretical argument about aircraft response based on weight to extend the mapping to include light and heavy class aircraft. It is important to understand that the EDR ranges for light and heavy aircraft weight classes in the table above have never been verified, and would be extremely difficult to do without a lot of data that simply doesn’t exist. Therefore, for light and heavy aircraft, these are educated guesses. In other words, your experience may vary. 

Using the EZWxBrief progressive web app vertical route profile, categorical thresholds are shown using four colors. Green represents light turbulence; tan represents moderate turbulence; and red represents severe turbulence. Although very rare, an area of dark red represents extreme turbulence (not shown in this profile).

In the end, the EZWxBrief vertical route profile shown above evaluates the proposed route for turbulence aloft and color codes the EDR thresholds based on the aircraft weight class from the table above. That is, if you have the aircraft maximum takeoff weight set as a “light” aircraft, green colors on the profile represent EDR values from 13 to 15, tan are values from 16 to 35, red are values from 36 to 63, and dark red are values from 64 to 100. This provides a categorical turbulence forecast for light, moderate, severe, and extreme turbulence, respectively. Any point without a green, tan, red, or dark red color is an EDR value of 12 or less indicating it should be a relatively smooth ride.    

Do you have a question about aviation that’s been bugging you? Ask us anything you’ve ever wanted to know about aviation. Our experts in general aviation, flight training, aircraft, avionics, and more may attempt to answer your question in a future article.

Login

New to Flying?

Register

Already have an account?