Question: On some NEXRAD images, I sometimes see a negative value for dBZ (decibel related to Z) for the reflectivity. How can these values be negative?
Answer: Of all of the weather guidance available to pilots prior to a flight, the images produced by the NWS WSR-88D NEXRAD Doppler radars are likely the most widely used in the U.S. These images have an extremely high glance value and are packed with important life-saving guidance assuming that a pilot knows how to interpret all the pretty colors.
The colors you see on the Nexrad image displayed by your favorite website or heavyweight electronic flight bag (EFB) app depend on many factors. Unfortunately, accepted standards do not exist in the industry. Any private organization, vendor, or government agency is free to map the data (e.g., reflectivity) to colors of their choosing (although certified displays in the cockpit do have standards). Depending on their operational requirements, they may use three colors representing light, moderate, or heavy precipitation—or they are free to use 30 different colors. So, it is important always to reference the scale that is normally located somewhere on the image or around the image border. For EFBs, that legend may be located on their interactive map, or you may have to look it up in their pilots guide.
More importantly, there are many kinds of images and products that you may encounter. Therefore, knowing the kind of radar image you are viewing is also paramount. The image may display base reflectivity from a single NWS Nexrad radar that is in clear-air mode. Or it may be one of the volume products such as composite reflectivity or echo top heights. Another possibility is that the image may represent a radar mosaic that has combined the base reflectivity or composite reflectivity data from multiple Nexrad sites into a regional or national image.
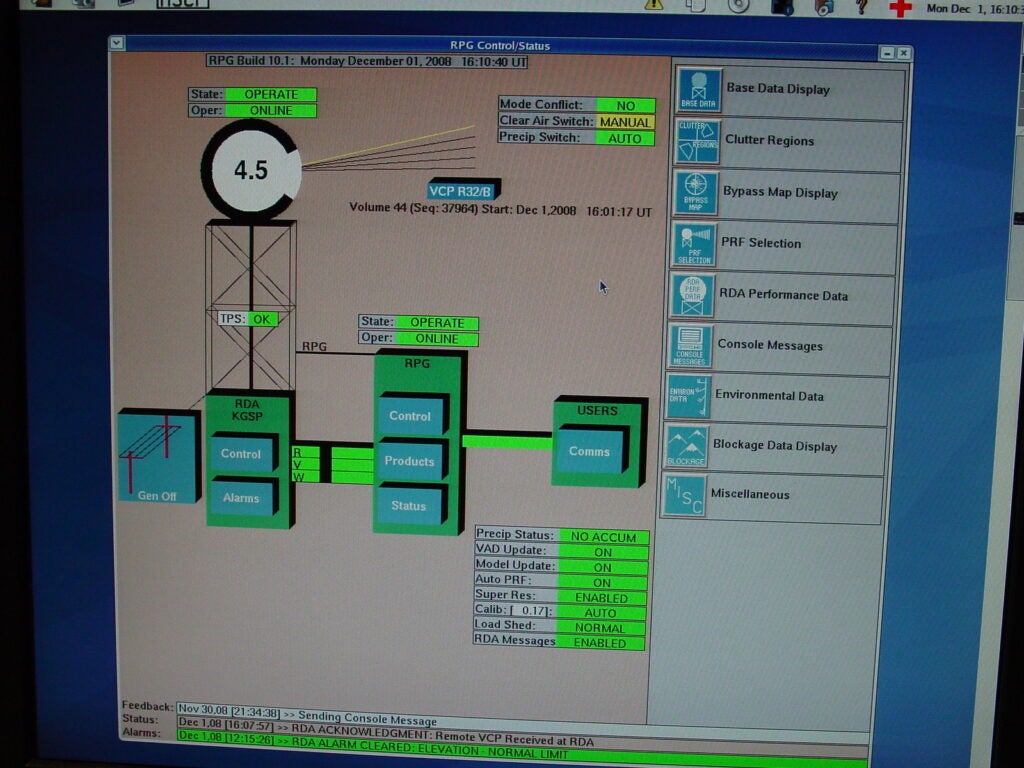
While forecasters at the various NWS local weather forecast offices (WFOs) do have real-time access to all of the data, the “raw” data that is generated by the WSR-88D Nexrad Doppler radars is not distributed directly to other government and private organizations in real time. Therefore, a Nexrad Information Dissemination Service (NIDS) has been established that includes only a subset of the entire WSR-88D base and derived products for use by external users. Below is the RPG console that you’ll find at every WFO that manages a WSR-88D Nexrad Doppler radar.

One of the most ubiquitous products is called base reflectivity. Note that the term “base” does not mean “lowest” as most pilots are taught or assume. It comes from the term “base data” since every elevation scan has a base reflectivity product (note in the image above that says “Base Data Display”). How you interpret the base reflectivity image will depend on the mode of the radar. In most cases, the base reflectivity will be the lowest elevation scan on various websites and apps since it better approximates the precipitation that is falling from the base of the cloud.
The WSR-88D radar operates in one of two modes: precipitation and clear air. The main difference between the two is that clear-air mode offers the advantage of greater sensitivity because of a slower antenna rotation rate, which allows more energy to be returned back to the radar. However, clear-air mode takes twice as long to generate a product so it suffers from temporal resolution, but is able to detect smaller objects in the atmosphere such as light snow or drizzle.
In either mode, the radar sends out a known pulse of energy in the microwave band (a wavelength of 10 cm to 11 cm). Some of this energy strikes airborne objects referred to as hydrometeors. This includes rain, snow, hail, dust, birds, insects, etc. and the power returned is referred to as the reflectivity parameter or Z. In basic terms, Z is the density of water drops (measured in millimeters raised to the sixth power) per cubic meter of air. As you might expect, there is a very wide range of possible Z values. Converting Z to dBZ (decibels of Z) makes that range smaller and easier to use.

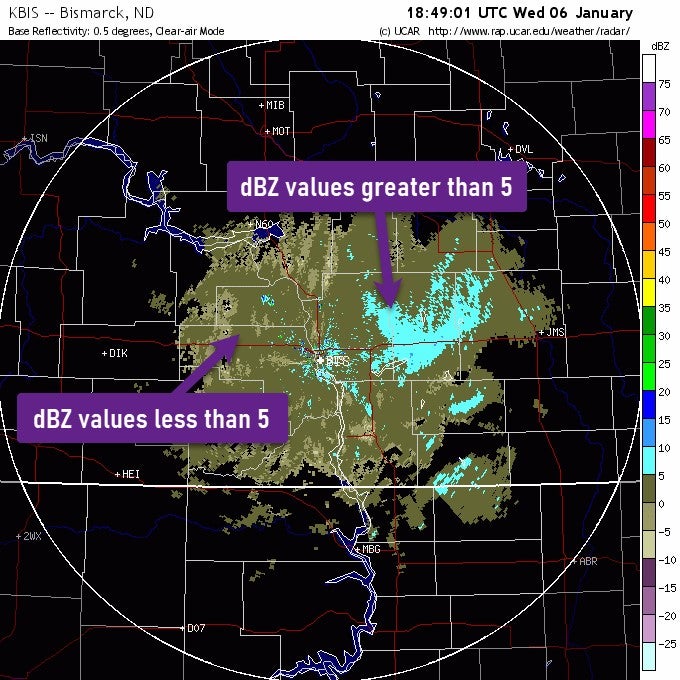
When the radar is in precipitation mode, the range of dBZ values displayed can be as low as 5 to a maximum of 75, whereas clear-air mode offers a range from -28 to +28. Negative dBZ values can occur in clear-air mode because dBZ is a logarithmic function. So, an increase of only 3 dBZ actually represents a doubling of power returned. Anytime Z is less than 1 mm6/m3, dBZ becomes negative because of the nature of logarithms. Negative dBZs are only found when the radar is in clear-air mode such as shown above. This radar image shows light snow falling around the Bismarck, North Dakota, area. Given that light snow is falling, the operator at the NWS set the radar to its most sensitive mode, namely, clear-air mode. Notice the negative dBZ values in the dark taupe color. If the radar were in precipitation mode, the amount of coverage would be limited to the baby blue areas.
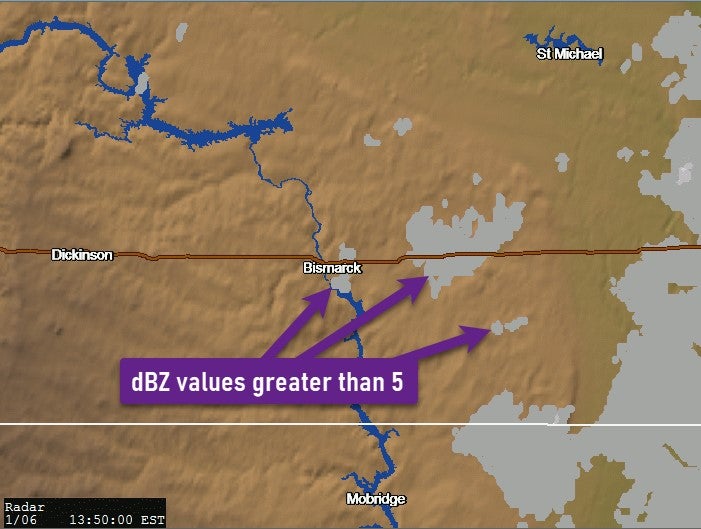
A negative dBZ means that the radar is detecting very small hydrometeors. As mentioned above, this is a great way for forecasters to detect very dry light snow or drizzle which have lower reflectivity values. One of the disadvantages of clear-air mode is that any dBZ value under 5 typically gets filtered by the datalink weather. The Nexrad clear-air mode image above shows a rather wide area of light precipitation around the Bismarck radar site that represents light snow in this case. However, the SiriusXM weather image shown below only includes the returns that are greater than 5 dBZ. The areas shown in the taupe color in the Nexrad image have been effectively filtered out of the SiriusXM-delivered product due to their lower dBZ values.

Do you have a question about aviation that’s been bugging you? Ask us anything you’ve ever wanted to know about aviation. Our experts in general aviation, flight training, aircraft, avionics, and more may attempt to answer your question in a future article.
