What Is an Outflow Boundary Shown on a Surface Analysis Chart?

Here’s a step-by-step guide to deciphering surface analysis charts—particularly ‘gust fronts.’

During the spring, summer, and fall, it is common to see the surface analysis chart issued by meteorologists at the WPC include dashed lines labeled as an outflow boundary. [Courtesy: National Oceanic and Atmospheric Administration.]

Question: What is an outflow boundary shown on a surface analysis chart?  

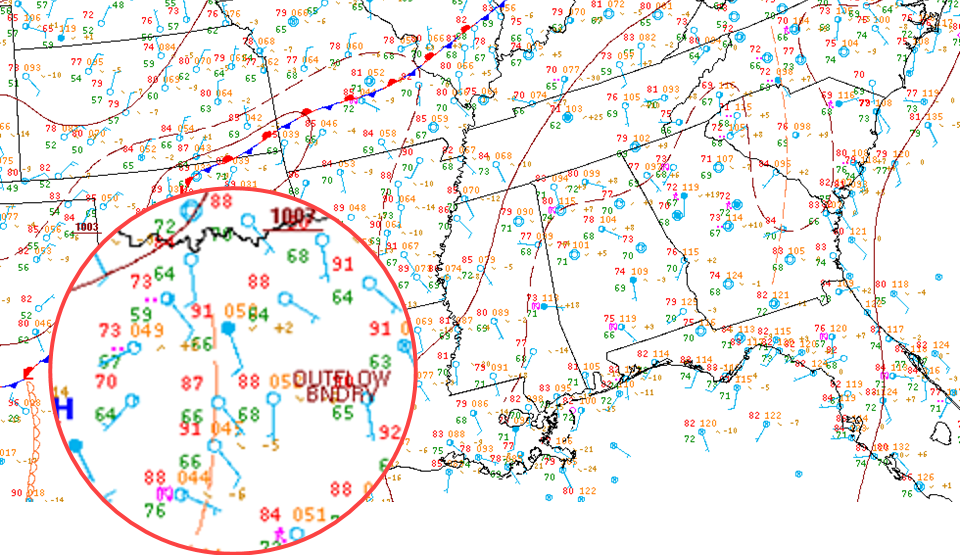
Answer: When looking at the surface analysis chart issued every three hours by meteorologists at the Weather Prediction Center (WPC), you may have seen a tan dashed line with a label “OUTFLOW BNDRY” nearby. This is what meteorologists call a convective outflow boundary.

You may view North American surface analysis here.

Convective outflow boundaries emanating away from thunderstorms are generated as cold, dense air descends in downdrafts then moves outward away from the convection to produce a mesoscale cold front also known as a “gust front.” 

Some gust fronts can be completely harmless or may be a precursor for an encounter with severe turbulence and dangerous low-level convective wind shear. The direction of movement of the gust front isn’t always coincident with the general motion of the thunderstorms. If the gust front is moving in advance of the convection, it should be strictly avoided. The pilot’s best defense is to recognize and characterize the gust front using METARs, ground-based radar, and visible satellite imagery.

As a thunderstorm evolves, it will bring in warm, moist air to feed the intense updraft (yellow), providing fuel for it to intensify. Once the precipitation core is too heavy to be supported by the updraft, cold, dense air will flow down through the storm (red), striking the ground and moving outward away from the convection that generated it. [Courtesy: Scott Dennstaedt]

According to research meteorologist and thunderstorm expert Charles Doswell, “cold, stable air is the ‘exhaust’ of deep, moist convection descending in downdrafts and then spreading outward like pancake batter poured on a griddle.” 

As a pulse-type thunderstorm reaches a point where its updraft can no longer support the load of precipitation that has accumulated inside, the precipitation load collapses down through the original updraft area. Evaporation of some of the rain cools the downdraft, making it even more dense compared to the surrounding air. When the downdraft reaches the ground, it is deflected laterally and spreads out almost uniformly in all directions, producing a gust front.

Gust fronts are normally seen moving away from weakening thunderstorm cores. Once a gust front forms and moves away from the convection, the boundary may be detected on the NWS WSR-88D NEXRAD Doppler radar as a bow-shaped line of low reflectivity returns usually 20 dBZ or less. Outflow boundaries are low-level events and do not necessarily produce precipitation. Instead, the radar is detecting the density discontinuity of the boundary itself along with any dust, insects, and other debris that may be carried along with the strong winds within the outflow. The gust front in southwest Missouri shows up very well on the NWS radar image out of Springfield as shown below.

Crescent-shaped convective outflow boundary as detected on NEXRAD Doppler weather radar. [Courtesy: University Corporation for Atmospheric Research]

An important observation is to note the motion of the gust front relative to the motion of the convection. In this particular case, the boundary is steadily moving south while the thunderstorm cells that produced the gust front are moving to the east. This kind of outflow boundary is usually benign, especially as it gains distance from the source convection. On the other hand, a gust front that is moving in the same general direction in advance of the convection is of the most concern. These gust fronts often contain severe or extreme turbulence, strong and gusty straight-line winds, and low-level convective wind shear.

As mentioned previously, gust fronts are strictly low-level events. As such, even the lowest elevation angle of the radar may overshoot the boundary if it is not close to the radar site. 

Shown below at 22Z, the NWS WSR-88D NEXRAD Doppler radar out of Greenville-Spartanburg, South Carolina, is the closest radar site and clearly “sees” the gust front (right image). However, the NEXRAD Doppler radar out of Columbia, South Carolina (left image), is farther away and misses the gust front completely. As the gust front moves away from the radar site, it may appear to dissipate, when in fact, the lowest elevation beam of the radar is simply overshooting the boundary. As a result, it is important to examine the NEXRAD radar mosaic image before looking at the individual radar sites.

Outflow boundaries are a low-level phenomenon. The lowest elevation angle beam from the NEXRAD radar located at the Columbia, South Carolina (CAE), weather forecast office (left) is overshooting the outflow boundary that is detected by the Greenville-Spartanburg NEXRAD radar site (right) located closer to the outflow boundary. [Courtesy: Scott Dennstaedt]

Not all gust fronts are easy to distinguish on visible satellite imagery; the gust front could be embedded in other dense clouds, or a high cirrus deck may obscure it. It is also possible that the boundary may not have enough lift or moisture to produce clouds. In many cases, however, it will clearly stand out on the visible satellite image. When the gust front contains enough moisture, as it was in this situation, cumuliform clouds may form along the boundary and move outward as can be seen in this visible image below centered on Charlotte, North Carolina. This is very common in the Southeast and coastal regions along the Gulf of Mexico given the higher moisture content. 

Convective outflow boundary emanating away from convection and captured on visible satellite imagery. [Courtesy: University Corporation for Atmospheric Research]

As this particular gust front passed through my neighborhood located south of Charlotte, strong, gusty northerly winds persisted for about 10 minutes. As is common, the main core of the precipitation didn’t start to fall for another 10 minutes. When a gust front such as this appears on satellite or radar, it is important to monitor the METARs and ASOS or AWOS closely for the occurrence of high winds. Several airports in the vicinity reported wind gusts peaking at 30 knots. The sky cover went from being just a few scattered clouds to a broken sky with these cumuliform clouds shown below moving rapidly through the region.

These cumuliform-type clouds were the result of a strong convective outflow boundary that moved through Fort Mill, South Carolina.  [Courtesy: Scott Dennstaedt]

As mentioned earlier, a gust front moving away from thunderstorms is a low-level event that can contain strong updrafts and downdrafts. The graph shown below is a time series, plotting the upward and downward motion or vertical velocity in a strong gust front as it moves over a particular point on the ground. 

The top half of the graph is upward motion and the bottom half is downward motion. Time increases from left to right. As the gust front approaches, the vertical velocity of the air upward increases quickly over a one- or two-minute period. While the maximum vertical velocities vary with height in the outflow, a common maximum number seen is 10 meters per second (m/s) at about 1.4 kilometers or 4,500 feet agl (25 knots is roughly 12 m/s for reference). 

As the gust front moves through, the velocities abruptly switch from an upward to a downward motion, creating strong wind gusts at the surface. Most outflow boundaries don't extend above about 2 kilometers or 6,500 feet agl. What is remarkable is that upward-to-downward motion changes in just about 30 seconds over the ground point where this was observed. But imagine flying an aircraft at 150 knots through this— the up-and-down exchange will happen in just a few seconds, producing a jarring turbulence event.

This vertical sounding sensor graph depicts the change of the air velocity in the vertical over a particular location. Notice as the outflow boundary moves through the sensor array that it is first met with an updraft and followed by a downdraft. [Courtesy: Scott Dennstaedt]   

Just in case you were wondering, gust fronts are conveniently filtered out by your datalink weather broadcasts as shown below for XM-delivered satellite weather. This is because the broadcast only provides returns from actual areas of precipitation. Often outflow boundaries or gust fronts produce low reflectivity returns that fall below the threshold used to filter out other clutter not associated with actual areas of precipitation. 

When in flight, pay particular attention to surface observations, looking for strong, gusty winds, before attempting a landing at an airport when storms are approaching. 

It is common to have outflow boundaries and gust fronts filtered out of radar mosaic from datalink weather broadcasts. Shown in the upper left is the unfiltered image from the Greenville-Spartanburg NEXRAD Doppler weather radar. It has been filtered out of the XM-delivered broadcast. [Courtesy: Scott Dennstaedt]

Scott resides in Charlotte, North Carolina, and flies regularly throughout the Mid-Atlantic and Southeast U.S. He is a CFI and former NWS meteorologist. Scott is the author of "The Skew-T log (p) and Me: A Primer for Pilots" and the founder of EZWxBrief.

Subscribe to Our Newsletter

Get the latest FLYING stories delivered directly to your inbox

Subscribe to our newsletter