fbpx

Two Kinds of Instrument Approach Charts

A look at Jeppesen and US government approach plates (d-TPPs)

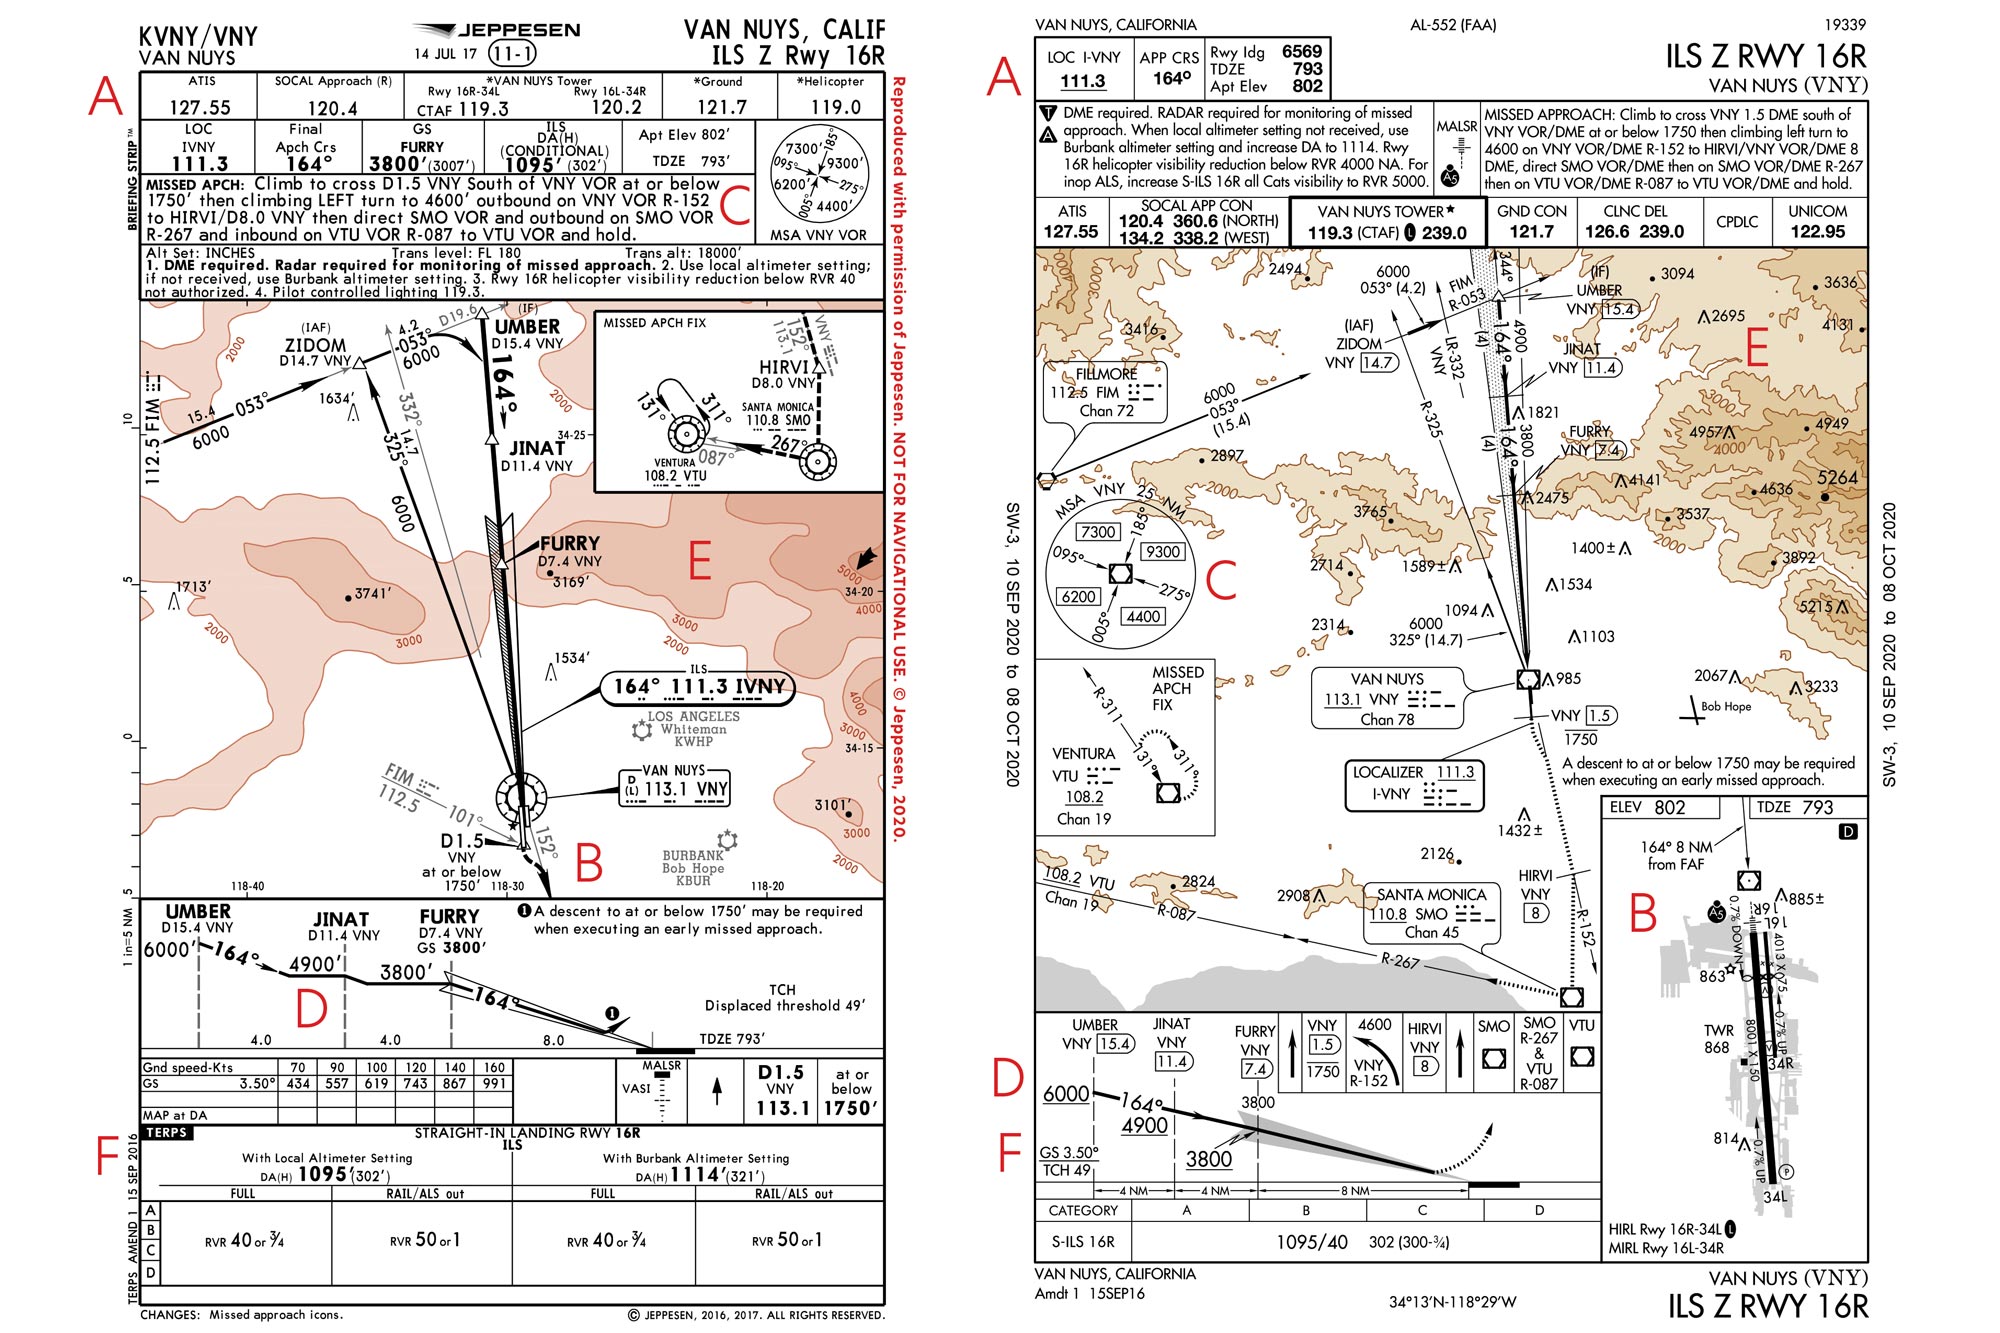
If you’re an active IFR pilot or training to become one in the US, you have a choice of two instrument approach-plate providers. One is Jeppesen (now within Boeing Global Services), and the other is the US government, which provides plates known as digital terminal procedure publications—and often known to pilots by two outdated terms: National Aeronautical Charting Office or National Ocean Service plates, named after the offices that once produced them. Most airline and corporate pilots tend to use Jeppesen plates rather than the d-TPPs, though, these days, either can be made available on iPads, tablets and other airborne flight management systems. A Jeppesen subscription costs more than access to comparable d-TPP content. Generally, the majority of necessary IFR approach information is contained on a single Jeppesen chart, whereas the government plates require the pilot to check a few different locations, for example, when it comes to obstacle departure procedures. This month, we’re taking another look at the Van Nuys ILS Z Runway 16 Right chart as presented by these two different providers.

There are many small details that differentiate these two approach-plate presentations, many more than we have room to note in this month’s brief. In the end, which one a pilot chooses often comes down a personal preference. Some pilots simply like the way information is depicted on one or the other.

Finally, a word of caution for pilots who regularly switch between the two providers: Be sure to understand the differences between the two while you’re still on the ground, or when you’re far enough out from the destination to not be rushed trying to gather important data. Once you’re about to commence the approach in the soup, it’s far too late.

Check out more charts: Chart Wise

A. “Briefing Strip” vs. Top-of-the-Chart Data Offerings

Jeppesen very specifically set up the trademarked structure of their Briefing Strip at the top of their charts to ease the approach-briefing process, with items laid out in a standardized sequence. Similar data is available on the d-TPP charts but in a different order, calling for a different briefing sequence.

B. Airport Diagram

One difference on d-TPPs is an airport diagram and runway depiction in the lower right. Jeppesen’s KVNY airport information is available in a larger format on a separate page.

C. Minimum Sector Altitude

Jeppesen depicts an approach’s minimum safe sector altitude in the upper right portion of the chart as a part of the briefing block. Alternately, d-TPPs place the MSA in the plan view—in this case, within the middle left quadrant.

D. Depicting Step-Down Hard Altitudes

Altitudes below which the pilot should not descend are shown on d-TPP charts as numbers with a black line drawn beneath them, while Jeppesen charts depict a step-down and level-off more graphically. Consider the descent from

JINAT (11.4 DME from the VNY VOR) to the FURRY glideslope intercept point at (7.4 DME). The d-TPP chart shows this as a constant descent angle but depicts passing altitudes of 4,900 and 3,800 as absolute minimums along the way. The Jeppesen version shows the descent as a series of step-downs with specific level-off points until reaching the next descent fix.

E. Terrain

Some pilots think d-TPP-chart terrain information is often extraneous and simply makes the plate too busy. Jeppesen charts typically provide a less cluttered, smoother depiction of terrain with fewer high points noted. Jeppesens, for instance, do not point out nearby radio/TV towers. The Jeppesen philosophy is that pilots don’t need this information if they are flying the procedure correctly. If they’re not able, the pilot should normally execute a missed approach.

F. Approach Speeds

This area’s a personal favorite, and it depends on the approach speed for each specific aircraft. For light aircraft, 100 knots is a common approach speed. The d-TPP speeds—60, 90, 120, 150 and 180 knots—are evenly separated and may require some interpolation for consistency. Jeppesen posts speeds of 70, 90, 100, 120, 140 and 160 knots, and this seems likely to match more-commonly used approach speeds.

This story appeared in the December 2020 issue of Flying Magazine

Login

New to Flying?

Register

Already have an account?