













Register

Skew-T Simplified, Pt. 2

Gemini Sparkle

Key Takeaways:

  • Skew-T diagrams are essential aviation weather tools, visually representing vertical profiles of temperature and moisture to reveal key atmospheric structures.
  • They are highly effective in identifying conditions conducive to aviation hazards, such as severe clear air turbulence (CAT) indicated by strong wind shear and unstable layers, and potential icing from temperature inversions and high humidity.
  • The article uses real-world case studies of a fatal icing incident and an extreme CAT event to illustrate how Skew-T diagrams can explain and help anticipate these dangerous meteorological conditions.
See a mistake? Contact us.

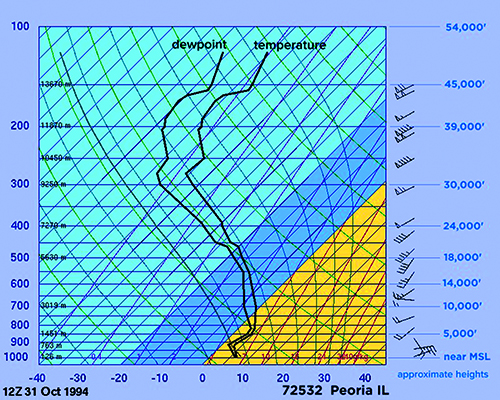
Last month, we took a close look at Skew-T (sounding) diagrams and how they’re constructed. To refresh your memory, Skew-T’s are simply diagrams showing a vertical profile of temperature and moisture at a given station at a given time. The up direction is increasing altitude, and the right-hand direction is increasing temperature or moisture. The data for the diagram is most often obtained using balloonlaunched radiosondes, but simulated Skew-Ts can be produced using analysis and numerical models.

These diagrams might seem intimidating, but they’re very easily found on the Internet, and sites like Pivotal‑Weather.com let you click on the numerical forecast maps along your route of flight and see a Skew-T. They can easily be brought up on any phone or tablet, and they’re provided as a single image that literally gives a myriad of keys and clues to the forecast puzzle unlike any other weather chart. How could you not pass this up?


Ready to Sell Your Aircraft?

List your airplane on AircraftForSale.com and reach qualified buyers.

List Your Aircraft
AircraftForSale Logo | FLYING Logo
Pilot in aircraft
Sign-up for newsletters & special offers!

Get the latest stories & special offers delivered directly to your inbox.

SUBSCRIBE