













Register

Reading Surface Charts

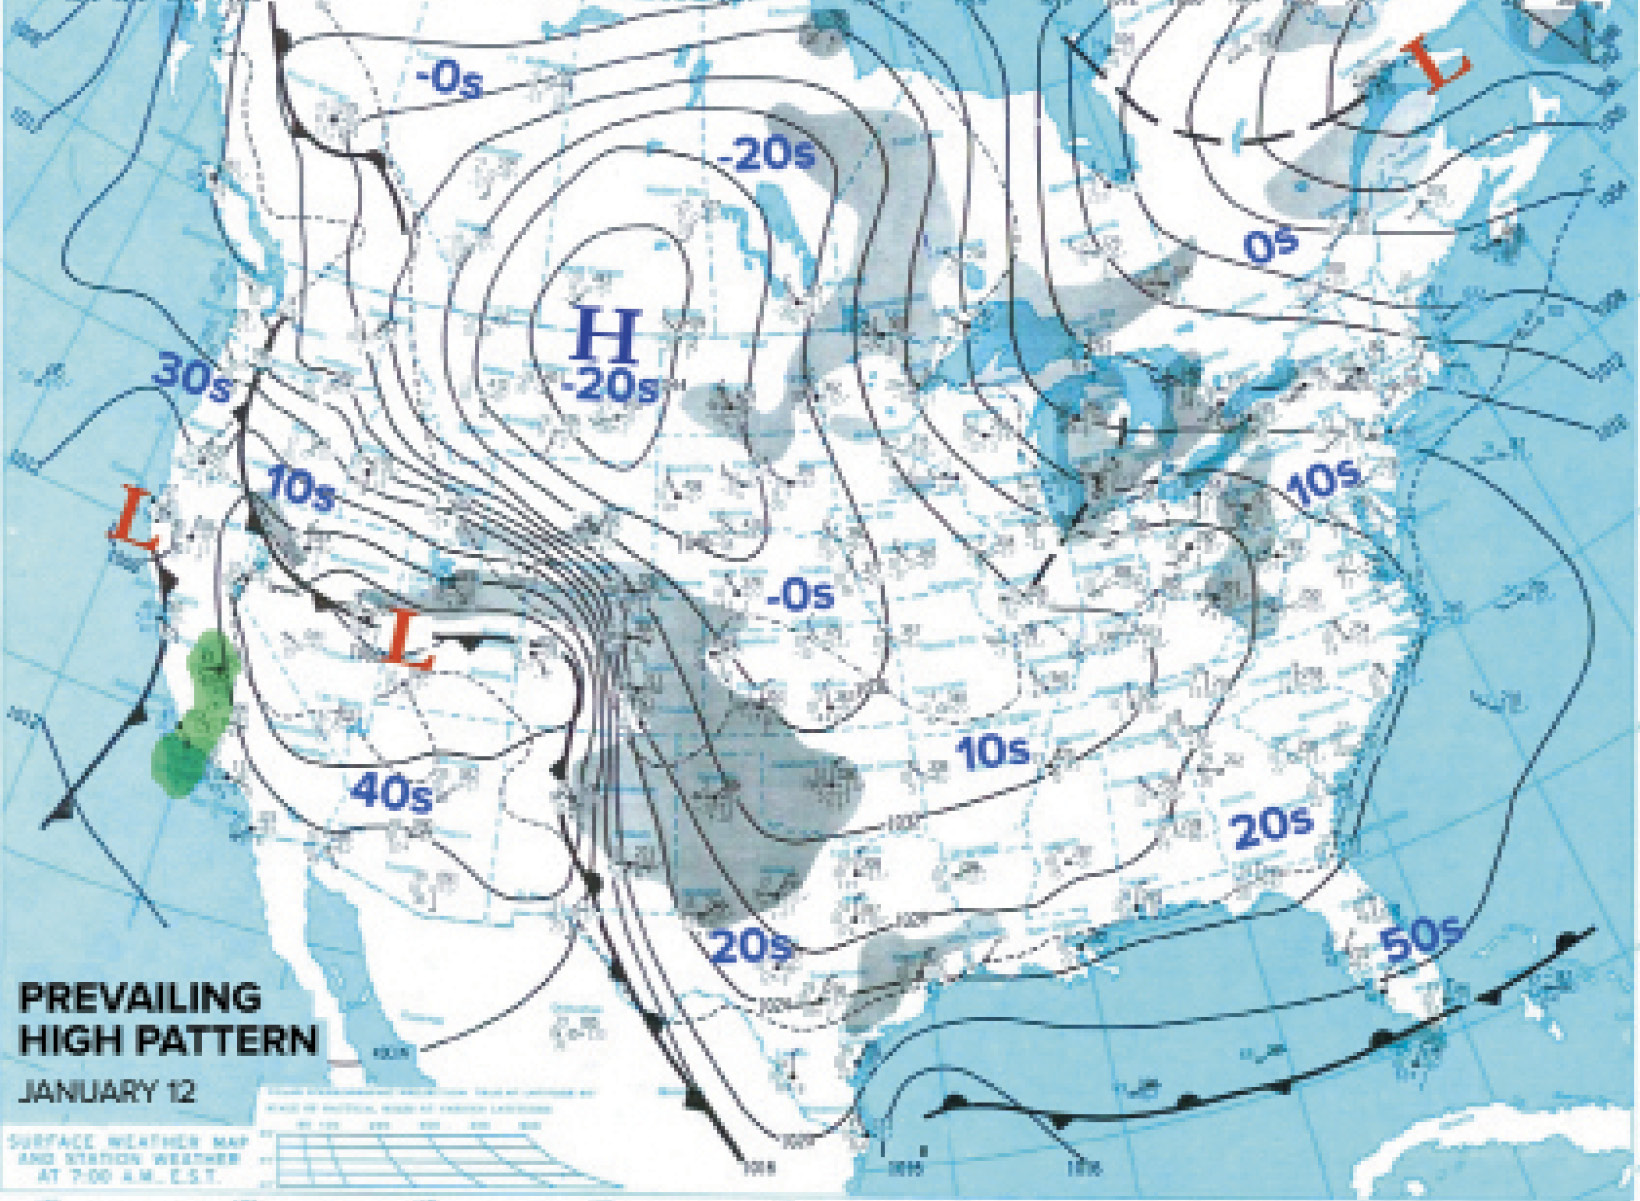
A prevailing high from Canada dominates most of the U.S. weather.
Gemini Sparkle

Key Takeaways:

  • The article details two fundamental cold-season weather patterns: the "Prevailing High," characterized by strong, cold Canadian high-pressure systems, and the "Pacific Storm System," which brings active weather, often including severe storms, from the Pacific into the U.S.
  • The "Prevailing High" pattern is known for extreme cold and very high altimeter settings, while the "Pacific Storm System" pattern is frequently responsible for destructive cold-season severe weather and tornadoes, particularly in the southeastern U.S.
  • Interpreting surface charts involves visualizing wind flow around pressure systems (clockwise for highs, counterclockwise for lows), considering terrain effects (e.g., upslope/downslope, lake-effect), and monitoring conditions like warm sector temperatures and dewpoints for severe weather potential.
See a mistake? Contact us.

Last month, we discussed upper-air charts and how they shed light on your flight plans. Now, let’s talk about surface charts. In the May 2021 issue we covered a little bit about surface charts, but focused mostly on how to read the station plots—the little groups of data found at each city. It’s time for a more in-depth look at weather patterns, as we put fronts and the ever-mysterious highs and lows under the microscope.

We’ll focus on two of the most fundamental weather patterns often seen during the fall, winter, and spring months: the prevailing high pattern and the Pacific storm-system pattern. Most of the interesting weather you encounter will fall into one of those two groups.


Ready to Sell Your Aircraft?

List your airplane on AircraftForSale.com and reach qualified buyers.

List Your Aircraft
AircraftForSale Logo | FLYING Logo
Pilot in aircraft
Sign-up for newsletters & special offers!

Get the latest stories & special offers delivered directly to your inbox.

SUBSCRIBE