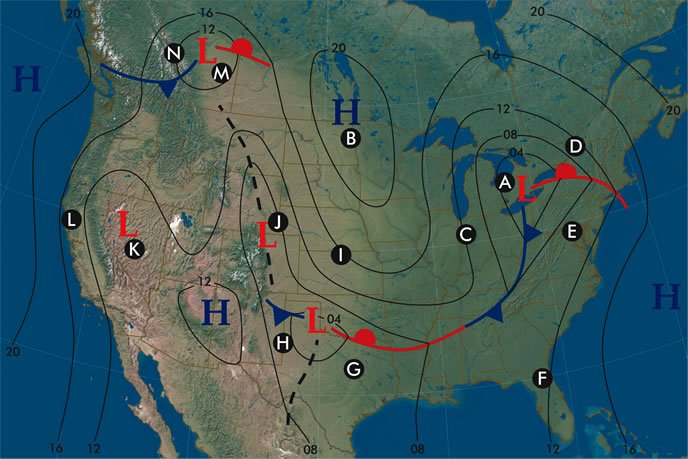

Aviation weather columns typically talk about hazards in terms of elements: “Watch the 0 to -20 degrees C layer for icing.” “Be cautious of wet, clear nights because of fog,” etc. We can always learn more from a change in perspective, and we can do so using surface charts from the Aviation Weather Center website. Using these charts we can get a better understanding of why weather hazards occur rather than how they develop. Let’s take a look at the sample chart below and break down all the patterns that are going on.