
Last month, we discussed upper-air charts and how they shed light on your flight plans. Now, let’s talk about surface charts. In the May 2021 issue we covered a little bit about surface charts, but focused mostly on how to read the station plots—the little groups of data found at each city. It’s time for a more in-depth look at weather patterns, as we put fronts and the ever-mysterious highs and lows under the microscope.
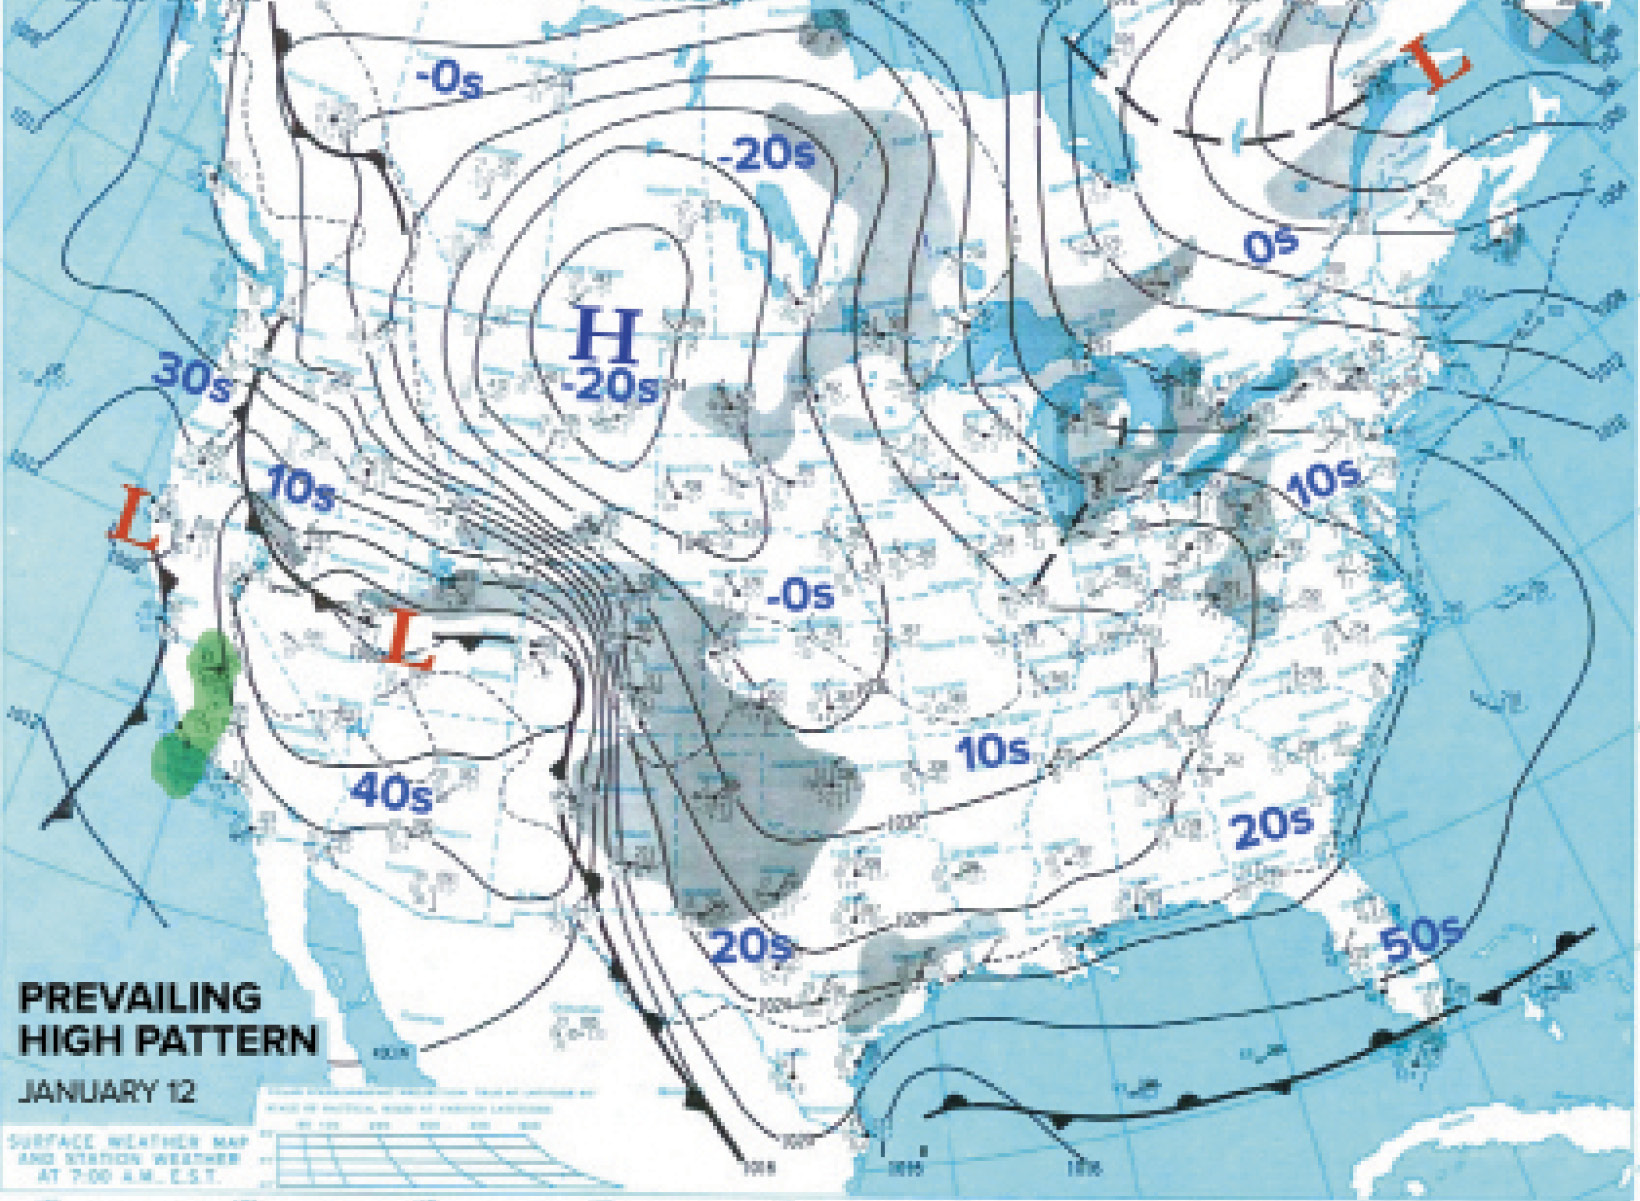
We’ll focus on two of the most fundamental weather patterns often seen during the fall, winter, and spring months: the prevailing high pattern and the Pacific storm-system pattern. Most of the interesting weather you encounter will fall into one of those two groups.