Routine flight operations typically occur in steady or quasi-steady flight: the traffic pattern, normal climbs and descents, cruise flight, even turns. Yet for all its complexities, skillfully piloting an airplane requires that we strike a balance between just three pairs of performance-defining parameters. Two of these are the force 288
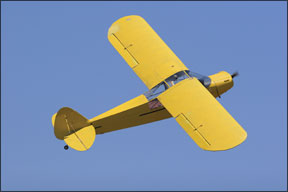
Pitch + Power = Performance
Routine flight operations typically occur in steady or quasi-steady flight: the traffic pattern, normal climbs and descents, cruise flight, even turns. Yet for all its complexities, skillfully piloting an airplane requires that we strike a balance between just three pairs of performance-defining parameters. Two of these are the force pairs lift and weight, and thrust and drag. Its a never-ending struggle to balance the weight of the airplane with lift, to balance the drag penalty resulting from that lift with thrust.
Key Takeaways:
- Aircraft performance is fundamentally managed by three pairs of parameters, with pitch (for airspeed/kinetic energy) and power (for altitude/potential energy) being the primary focus.
- The power curve diagram is a critical tool visualizing the relationship between available and required power, providing a snapshot of an aircraft's performance under specific conditions.
- Key operating speeds like maximum endurance (Ve), best rate of climb (Vy), best glide (Vbg), and best angle of climb (Vx) can be derived from the power curve diagram to optimize flight for time, distance, or altitude.
- Pilots must adapt their pitch and power inputs based on changing flight conditions and the understanding that "pitch for the speed you need; power for the desired altitude profile" is the unambiguous law of flight.
Key takeaways sponsored by Aviator Pro | Start Your Training ->
See a mistake? Contact us.