











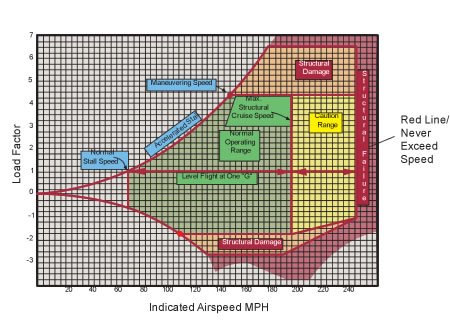


Youve probably seen something like the chart below before in your studies. Its known variously as a V-G diagram, gust diagram or simply an airplanes flight envelope. From it, we can determine the g-loading the represented airplane will experience when accelerated beyond 1G at various airspeeds. For example, the airplane depicted may suffer structural damage at 200 mph if it encounters conditions leading to a 4G loading. Those conditions can include pilot input, turbulence or some combination.