













Register

Mastering Short-Haul IFR

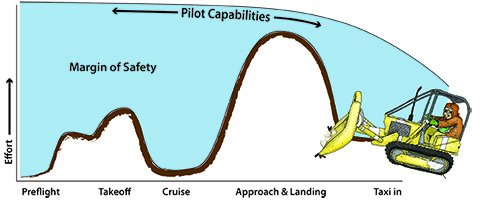
Picture one of those ubiquitous human factors graphs that show pilot workload during a flight. The x-axis shows startup through shutdown. On the y axis, is a scale of pilot workload: relatively low during taxi, a significant spike during takeoff and departure, a long, low flat line for cruise, an even bigger spike for approach and landing and an anti-climactic taper-off for taxi in. At the top of the graph, theres an additional line that starts high and arcs slowly down representing the pilots capabilities.

Gemini Sparkle

Key Takeaways:

Picture one of those ubiquitous human factors graphs that show pilot workload during a flight. The x-axis shows startup through shutdown. On the y axis, is a scale of pilot workload: relatively low during taxi, a significant spike during takeoff and departure, a long, low flat line for cruise, an even bigger spike for approach and landing and an anti-climactic taper-off for taxi in. At the top of the graph, there’s an additional line that starts high and arcs slowly down representing the pilot’s capabilities.


Ready to Sell Your Aircraft?

List your airplane on AircraftForSale.com and reach qualified buyers.

List Your Aircraft
AircraftForSale Logo | FLYING Logo
Pilot in aircraft
Sign-up for newsletters & special offers!

Get the latest stories & special offers delivered directly to your inbox.

SUBSCRIBE