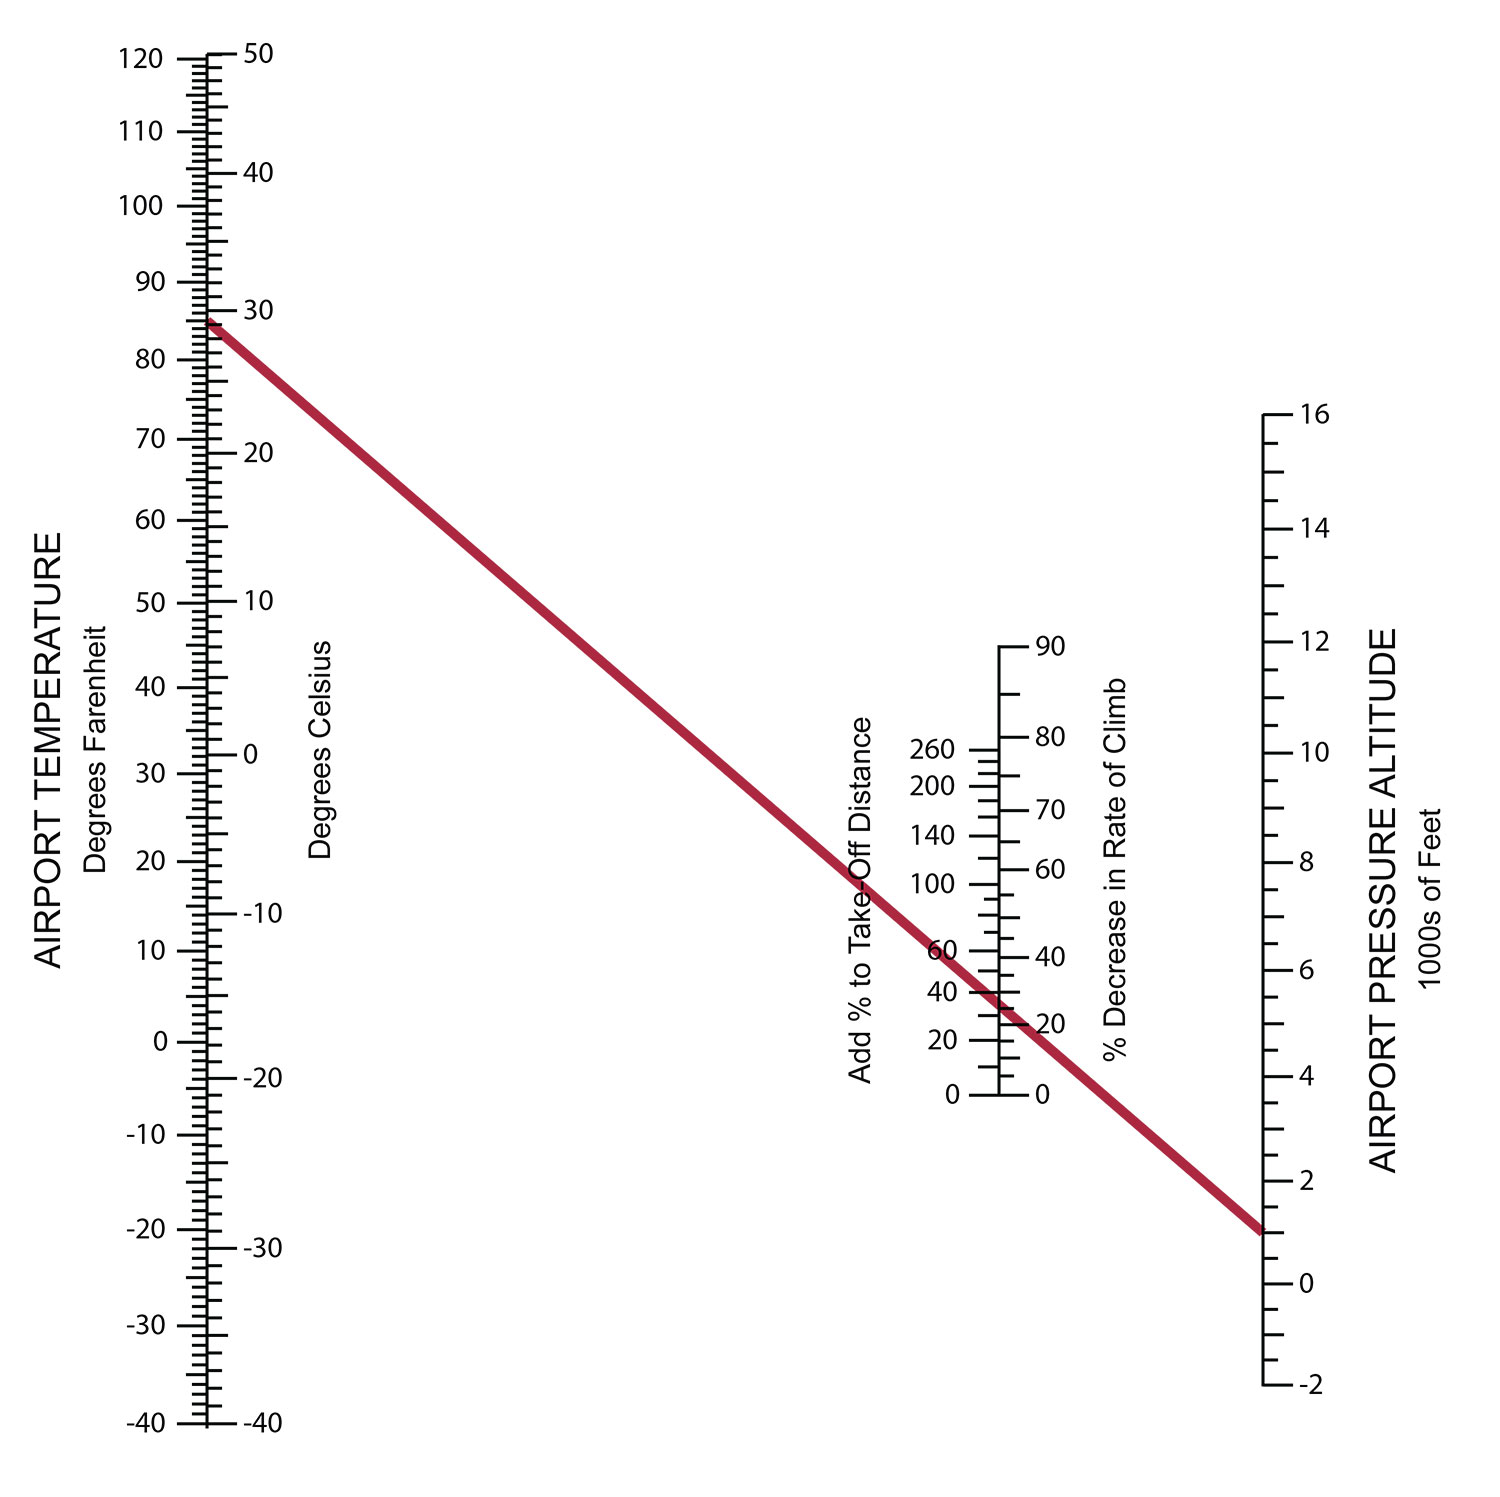
A real Koch chart is reproduced above. To use it, draw a straight line between the temperature (85 degrees F) on the left and the pressure altitude (1000 feet) on the right. Read the results from the center (35 percent increase in takeoff distance and a 25 percent reduction in climb rate).
Key Takeaways:
Readers provided corrections to two previous articles, one clarifying the proper use and identity of a Koch chart for performance calculations, and another correcting potentially unsafe advice regarding missed approach procedures during circling.
A senior pilot and Aviation Medical Examiner shared an inspiring account of maintaining active flying status into old age, emphasizing that there are no age restrictions for a First Class Medical and that aviation significantly contributes to quality of life and camaraderie.
In the December 2023 issue, the figure on page 5 is not a Koch chart, but rather a chart for computing pressure altitude.
A Koch chart normally has a pressure altitude scale on the right and temperature on the left. In the center are scales for correcting takeoff distance and climb rate relative to sea level values.
CREATE A FREE ACCOUNT
Sign up to keep reading
Create a free account to continue. Already a member? Sign in below.