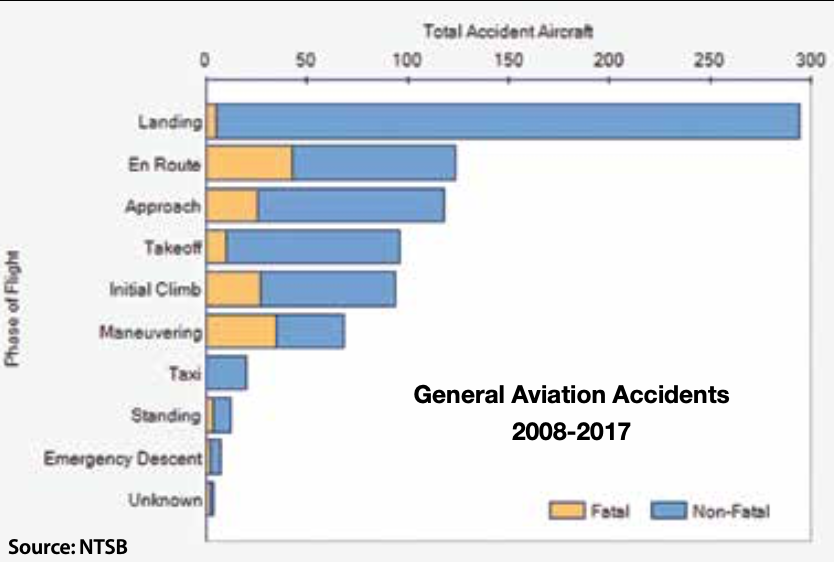
The NTSB recently updated its rolling 10-year look-back infographics to reflect data from CY 2017, including the bar chart at right. This graphic compares the phases of flight in which personal-flying accidents occurred over the period, and shows maneuvering accidents are fatal roughly half the time.
Safety in Numbers
Key Takeaways:
- The NTSB updated its 10-year look-back infographics for personal-flying accidents, incorporating data through CY 2017.
- The updated graphics compare the phases of flight where these accidents occurred.
- A key finding is that approximately half of all personal-flying accidents occurring during the maneuvering phase are fatal.
Key takeaways sponsored by Aviator Pro | Start Your Training ->
See a mistake? Contact us.