Safety in Numbers
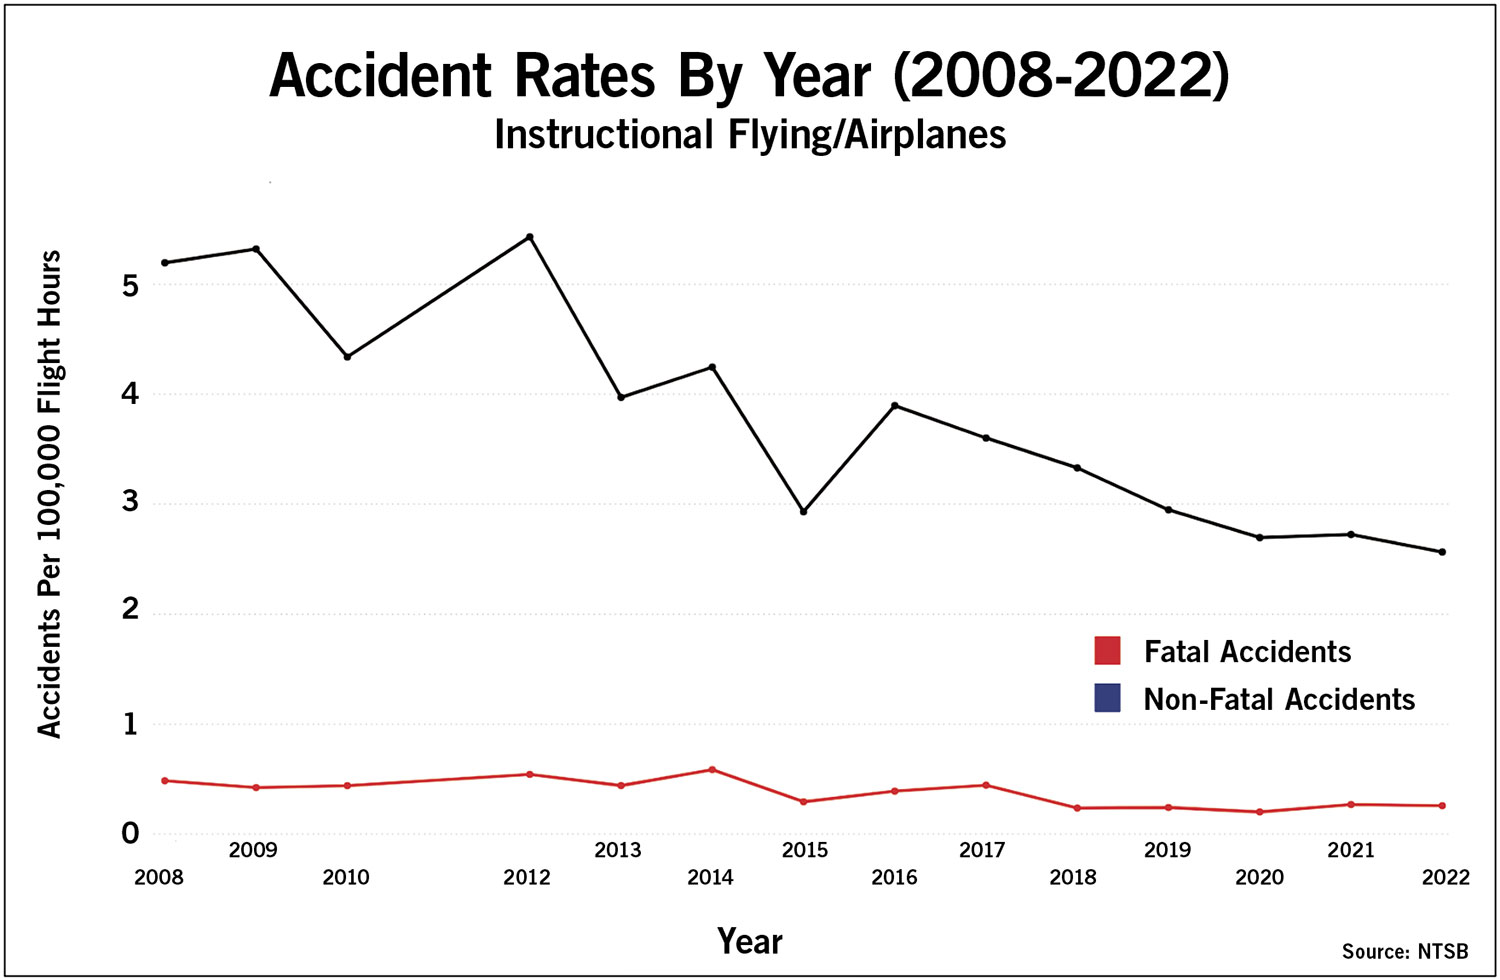
The line graph above presents accident rates for instructional flights aboard airplanes for the years 2008 through 2022. (There is no activity data for 2011, so that year’s accident rates cannot be calculated.) While non-fatal accidents have declined substantially over the period, fatals have not.
April 1, 2024, Muncie, Ind.
CREATE A FREE ACCOUNT
Sign up to keep reading
Create a free account to continue. Already a member? Sign in below.
CREATE A FREE ACCOUNT
Sign up to keep reading
Create a free account to continue. Already a member? Sign in below.
OUT OF FREE ARTICLES
You've used your free articles
You've read all of your free articles for now. Subscribe for unlimited access to every story.
Need help? Contact us
